
Debugger
The debugger steps through a PL/pgSQL function or procedure line by line, as pgAdmin's debugger does: you give the arguments, the call stops at its first statement, and you step, set breakpoints, read and change variables, and see the result. It opens from a routine's editor, with the Debug link, at /db/<db>/schema/<schema>/routines/<function|procedure>/<oid>/debug. With Set breakpoint it waits instead for another session to call the routine, which is how a trigger function is debugged (in-context debugging).
Requirements
The debugger is EDB's pldebugger, the extension pgAdmin uses. All of these must hold, or the Debug link is not shown:
| Requirement | How |
|---|---|
The pldbgapi extension in the database | CREATE EXTENSION pldbgapi; (the package is postgresql-<major>-pldebugger on Debian/Ubuntu, pldebugger_<major> on RHEL) |
plugin_debugger preloaded on the server | shared_preload_libraries = 'plugin_debugger' in postgresql.conf, then a restart |
| The debugger switched on in phpPgAdmin | on by default; PGADMIN_DEBUGGER=0 (debugger in config/tools.php) switches it off |
| A PHP command-line binary on the web server | the session runs in the background with it (PGADMIN_PHP_BINARY, see Import) |
| A PL/pgSQL routine | functions and procedures in plpgsql only; SQL, C and other languages cannot be stepped |
When one is missing, the debug page names it instead of the arguments:

Two connections
A session opens two connections as your role: one runs the call, the other drives it through pldbgapi's functions. The docs were checked as a superuser; pldebugger itself decides what other roles may do.
Starting a session
Open the routine (click it in the navigation tree, or Edit on the schema's Routines page). Under the title is Debug:

Arguments lists the routine's
IN,INOUTandVARIADICarguments with their type and default. For each one, type a Value, or tick Null?, Expression? (the value is SQL, written as is, such asnow() - interval '1 day'), or Use default? (offered when the argument has a default, and ticked at first).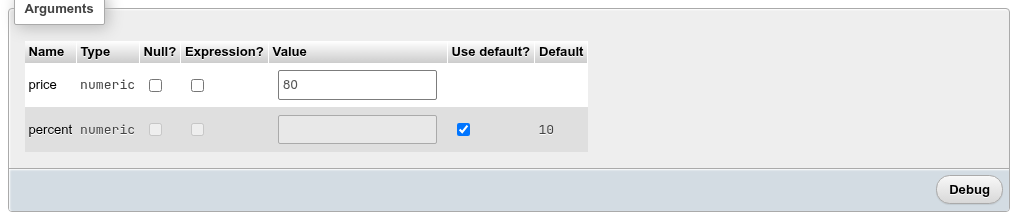
Click Debug. The call is written as pgAdmin writes it and shown under the toolbar:
SELECT * FROM public.apply_discount('80'::numeric)for a function,CALL schema.proc(…)for a procedure (withNULLfor itsOUTarguments). A value is a literal cast to the argument's type.
Defaults only at the end
An argument left on its default leaves itself and every argument after it out of the call, so only the last arguments can use their defaults. Giving a value after a defaulted one is refused (Only the last arguments can take their defaults…).
The session
The call stops at its first statement. The page shows the toolbar, the call, the routine's source with the current line highlighted, and the tabs.
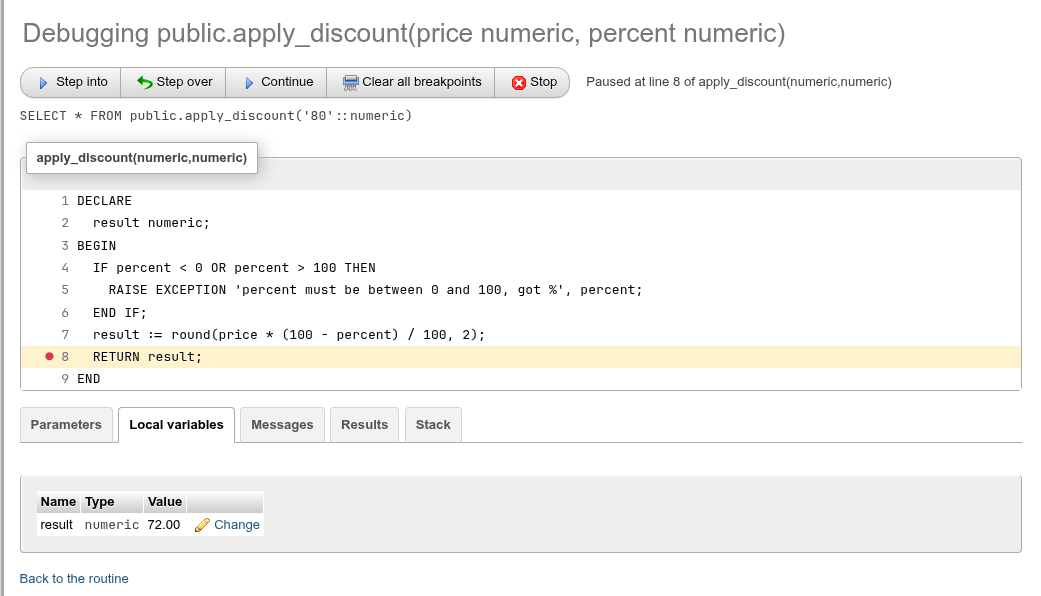
| Button | pldebugger | What it does |
|---|---|---|
| Step into | pldbg_step_into | runs to the next statement, entering a PL/pgSQL routine the statement calls |
| Step over | pldbg_step_over | runs to the next statement of this routine |
| Continue | pldbg_continue | runs to the next breakpoint, or to the end |
| Clear all breakpoints | pldbg_drop_breakpoint for each | |
| Stop | pldbg_abort_target | aborts the call and ends the session; becomes Close once the call has ended |
The status next to the toolbar says Paused at line 8 of apply_discount(numeric,numeric), Running…, The call has ended. or The call ended with an error. The buttons are greyed while a command runs and once the call has ended.
Line numbers
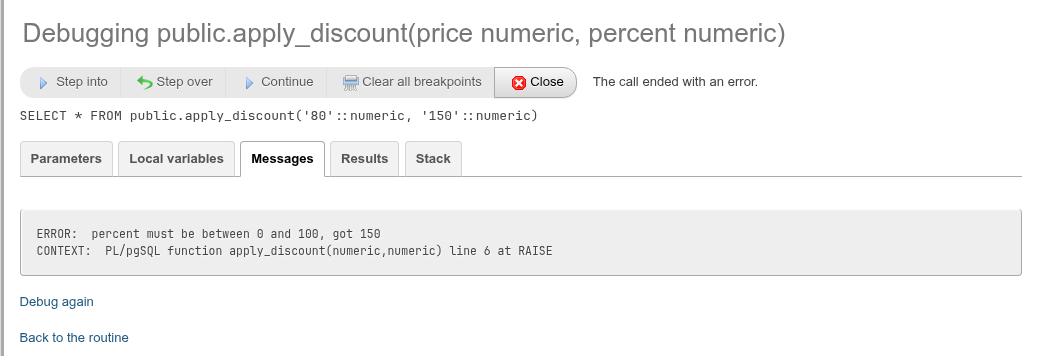
The source, the status, the breakpoints and the Stack tab number the lines as the routine editor does: line 1 is DECLARE, and RETURN result; is line 8 in both. PostgreSQL's own error context counts the line break right after $$ as line 1, so its numbers are one higher than these for a body that starts on a new line: PL/pgSQL function apply_discount(numeric,numeric) line 6 at RAISE is RAISE EXCEPTION … on line 5 here.
Breakpoints
Click a line number in the source to set a breakpoint (a red dot) and again to remove it. Breakpoints can be set only while the call is paused. A breakpoint on a line without a statement (END IF;, END, a declaration) never stops the call: Continue runs past it to the end.
Variables, messages, results, stack
| Tab | Shows |
|---|---|
| Parameters | the arguments: name, type, value |
| Local variables | the variables declared in the current block (result, loop variables, FOUND…) |
| Messages | the call's NOTICEs and the like, and its error when it fails |
| Results | the call's result rows once it has ended (up to 1000 rows) |
| Stack | the frames of the call, the current one first, with their arguments; click a frame to show its source and variables |
While paused, Change next to a variable asks for a new value and assigns it (pldbg_deposit_value); the routine goes on with it. In the clip above, changing result to 1.23 before RETURN made the call return 1.23.

The Stack tab shows each frame's line, the same as the status for the current frame (here line 8, RETURN result;).
The end of the call
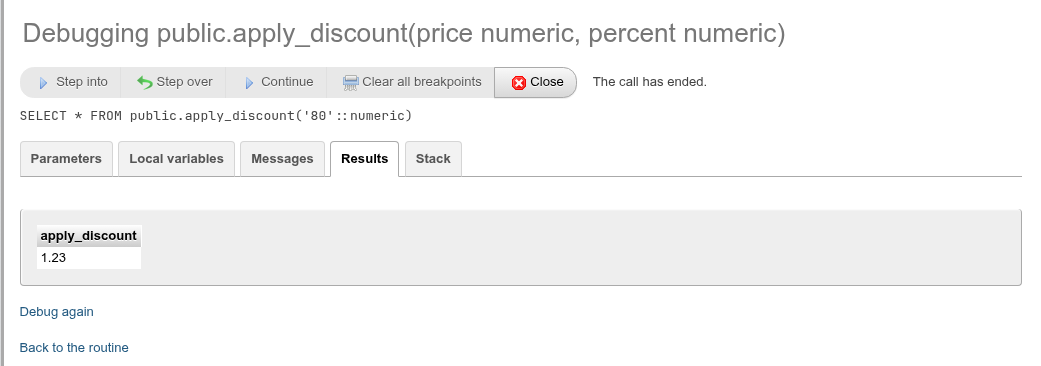
When the call returns, Results shows its rows; when it raises an error, Messages shows it with its context:
The last step takes a few seconds
After the step or Continue that runs past the routine's last statement, the page waits until pldebugger releases the call — 6 to 9 seconds on the docs server — before The call has ended. and the result appear. Steps inside the routine answer at once.
Click Close (or Debug again under the tabs) to return to the arguments dialog for another call.
How a session lives
A session is bin/debugger-session.php, started in the background on the web server. It holds both connections between your clicks; the page's commands reach it on a Unix socket that only the web server's user can open, and only the browser session that started it may drive it.
- Leaving the page within phpPgAdmin (a link, a tab, Back to the routine) stops the session and aborts the call.
- Closing or reloading the browser tab or window stops it too: the page sends the stop as it goes away (
navigator.sendBeacon). - If the page cannot say so (the browser crashes, the computer sleeps or loses its network), the session ends on its own: an open page sends a heartbeat every 30 seconds, and a session that has heard neither a heartbeat nor a command for 3 minutes aborts its call. Until then a paused call keeps its transaction open, with the locks it has taken. A client of the API that sends no heartbeat has 30 minutes between commands.
- A paused call can also hold up
DROP DATABASEof any database on the server: PostgreSQL waits for every backend to acknowledge it, and a backend waiting inside pldebugger does not until the call goes on or is stopped. - A step that runs longer than 120 seconds (a long loop to the next breakpoint) gives up waiting in the page with The debugging session did not answer.; the session itself goes on.
Debugging runs the routine for real
The call runs inside a transaction that Stop rolls back, but a call that reaches its end commits like any other statement: rows a procedure inserts stay. Debug routines that change data on a copy, or stop before the end.
In-context debugging (Set breakpoint)
pgAdmin's Set breakpoint, its indirect debugging: instead of starting a call yourself, you set a global breakpoint on the routine and wait for another session to call it. An application's request, a psql session, or a statement that fires a trigger: the first call of the routine from any session stops at its first statement and is debugged on this page, with the same toolbar and tabs. It is the way to debug a trigger function, which cannot be called on its own.
- Open the routine's editor. Beside Debug is Set breakpoint; a trigger function has only Set breakpoint. The link is shown to superusers only: pldebugger's global breakpoints need one (You must be a superuser to set a global breakpoint and perform indirect debugging.).
- Click Set breakpoint on the card that opens (
…/debug?mode=indirect). The status reads Waiting for another session to call the routine…. - Call the routine from elsewhere, for example
INSERT INTO orders …for a trigger function onorders. The page stops at the routine's first statement and names the session: Paused at line 2 of audit_orders() (session 50312). - Step, set breakpoints, read and change variables as in a direct session. A trigger function's variables include
new,old,tg_opand the other trigger variables. - Continue to the end lets the other session's statement go on: The call in session 50312 has ended. Its result is that session's. Stop aborts that session's statement (canceling statement due to user request in it), as pgAdmin's Stop does.
Only the first call is debugged; the breakpoint goes when the session ends. Click Debug again to wait for the next one. While the page waits or is paused, the other session waits too, so do this on a test server or with a call you make yourself. The other session's messages and result are shown there, not here.