
Status and monitoring
The Status tab at server level (/server/status) shows what the server is doing, from PostgreSQL's own statistics views. A row of pills switches between its pages: Server, Processes, Query statistics, Counters, Locks, Prepared transactions, Monitor, Logs and Background jobs. The pages follow phpMyAdmin's Status pages; the data and actions are pgAdmin's dashboard. Logs has a page of its own: Server logs.
Server
Server (/server/status) summarises the cumulative counters of pg_stat_database, summed over every database:
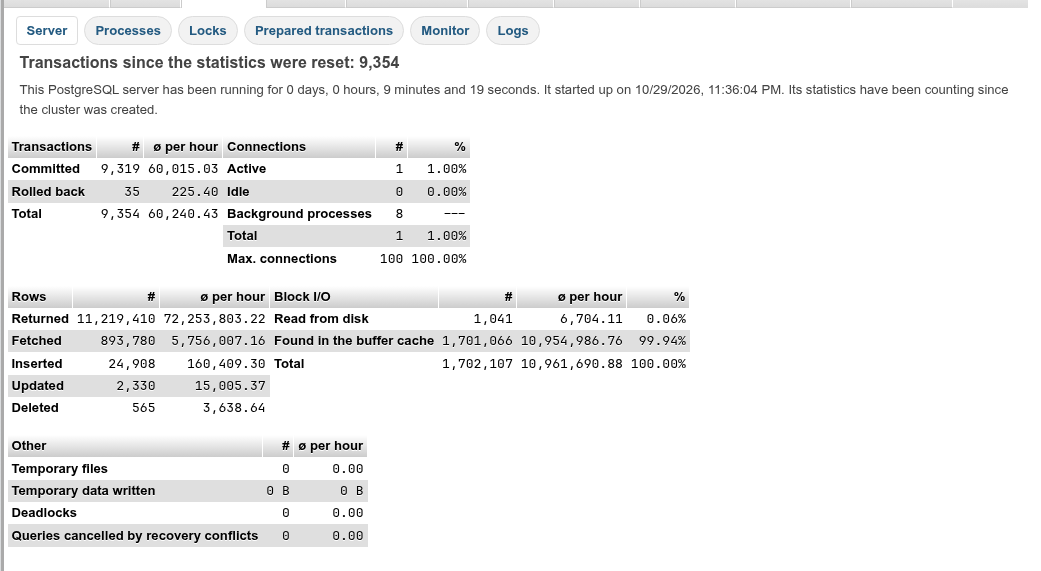
- The heading counts the transactions (committed plus rolled back) since the statistics were last reset.
- The line under it gives the uptime and start time (
pg_postmaster_start_time()), and since when the counters have been counting: the time of the oldeststats_reset, or since the cluster was created when they were never reset. - Transactions, Rows (returned, fetched, inserted, updated, deleted) and Other (temporary files and bytes, deadlocks, queries cancelled by recovery conflicts) give each counter and its average ø per hour over that period.
- Block I/O splits block reads into Read from disk and Found in the buffer cache, with the share of each: the cache hit ratio.
- Connections counts client sessions of
pg_stat_activityby state (Active, Idle, and the idle-in-transaction states when there are any) againstmax_connections; Background processes are the server's own processes (checkpointer, WAL writer, autovacuum and so on), not counted in the total. Hover 100.00% of Max. connections for how many are reserved for superusers. - On a standby a note says the server is in recovery.
The page loads once; reload it (or switch pills) to refresh.
ø per hour after a restart
When the counters were never reset, the averages divide by the time since the server started, while PostgreSQL keeps the counters across a clean restart. After a restart the per-hour figures are therefore too high until the counters are reset (SELECT pg_stat_reset(); in each database).
Processes
Processes (/server/status/processes) lists pg_stat_activity, like phpMyAdmin's process list with pgAdmin's Sessions panel.
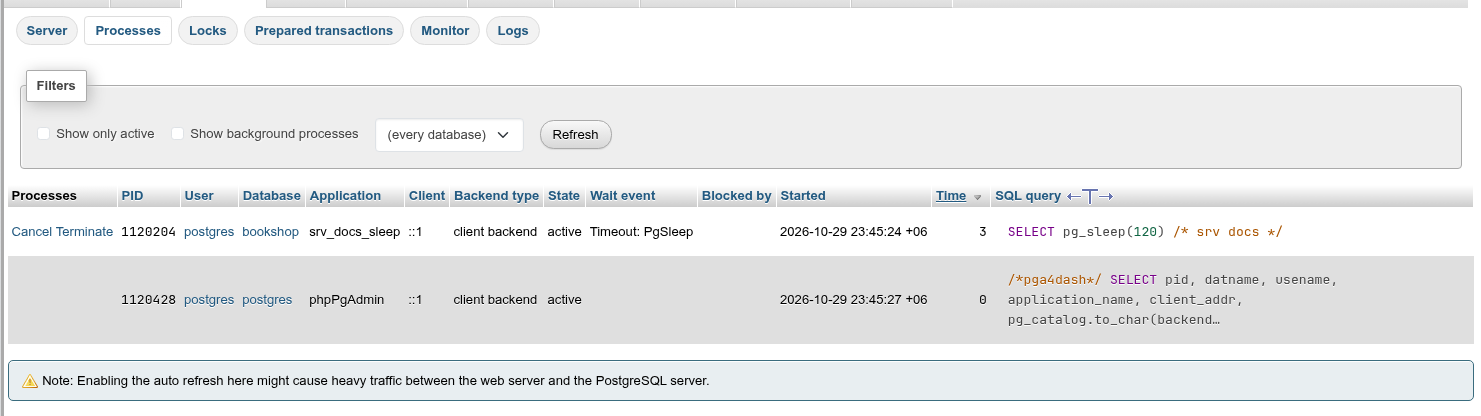
The Filters card:
| Control | What it does |
|---|---|
| Show only active | Only sessions whose state is active. Applied at once. |
| Show background processes | Also list the server's own processes (checkpointer, walwriter, autovacuum launcher, I/O workers…). Off by default: only client backends are listed. |
| database select | Only sessions connected to that database; (every database) lists all. Applied at once. |
| Refresh | Reloads the list. |
Columns: PID, User (links to the role), Database (links to it), Application (application_name), Client (address, or local socket), Backend type, State, Wait event (type and name), Blocked by (pg_blocking_pids()), Started (backend_start), Time (seconds the current statement has been running; 0 when not active) and SQL query. Click a column heading to sort by it; click again for descending order. The query is shown on one line, cut at 100 characters; the icon next to SQL query switches to Show full queries and back.
A session waiting for a lock is highlighted, and Blocked by names the PID holding it:

Cancel and terminate a session
Each client session other than your own has two links:
- Cancel runs
pg_cancel_backend(pid): the current statement fails with canceling statement due to user request; the session stays connected. - Terminate runs
pg_terminate_backend(pid): the session is closed and its open transaction is rolled back.
Both ask first, showing the statement:
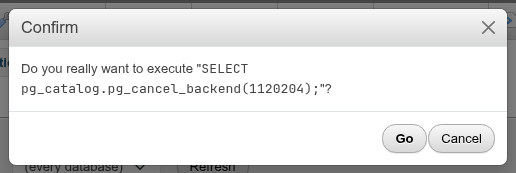
On success the message is The query of process N has been cancelled. or Process N has been terminated., and the list reloads.
Who may signal whom
A superuser may cancel or terminate any session. Other roles may signal only sessions of roles they are a member of, or every non-superuser session when they are members of pg_signal_backend. Signalling a superuser's session without being one fails with permission denied to cancel query. If the process has already ended, the page says Process N could not be signalled: it may have ended already.
Commands in progress
Under the list, a card for each pg_stat_progress_* view that has rows shows the commands running now with their phase and counters, one column per view column: VACUUM (pg_stat_progress_vacuum), ANALYZE, CREATE INDEX and REINDEX (pg_stat_progress_create_index), CLUSTER and VACUUM FULL, COPY and base backups. relid is the table's OID in that database. The cards reload with the list, also under auto refresh.
Auto refresh
Under the list are phpMyAdmin's note about traffic, the Refresh rate select (2 seconds up to 20 minutes, 5 seconds by default) and Start auto refresh / Stop auto refresh. While it runs the list reloads at that rate. The same controls are on the Locks page.
What a role that is not a superuser sees
Without pg_read_all_stats (or pg_monitor), PostgreSQL hides the details of other roles' sessions. Those rows have no user, database or backend type, so they drop out of the default list and appear only with Show background processes, as <insufficient privilege>.
Query statistics
Query statistics (/server/status/queries) is phpMyAdmin's page of the same name for PostgreSQL: the statements counted by the pg_stat_statements extension.
- The heading counts the statement calls since the statistics were last reset (
pg_stat_statements_info.stats_reset), followed by their average per hour, per minute and, from one a second, per second. - The table lists the top 100 statements by the sorted column, total time by default: Statement (normalized, with
$1for constants; cut at 100 characters until the full-text icon is clicked), Database (when every database is shown), User, Calls, Total time (ms), Mean time (ms), Rows, Shared blocks hit, Shared blocks read, and %, the statement's share of the total execution time. Click a numeric column heading to sort by it; click again for ascending order. With more statements a line says how many are listed. - The database select reads the view in that database and keeps only its statements. (every database, read in the maintenance database) reads it in the maintenance database, which shows the statements of every database.
- Reset asks, then runs
SELECT public.pg_stat_statements_reset();(with the extension's schema): every statement's counters start again. It needs a superuser or a role grantedEXECUTEon the function.
The extension must be installed in the database that is read, and its library loaded at server start. Otherwise the page says which step is missing instead of the table:
| The page says | Do |
|---|---|
| the extension is not installed in the database | Create pg_stat_statements on the database's Objects page (the link opens its Extensions list), or run CREATE EXTENSION pg_stat_statements; there. To see every database's statements, create it in the maintenance database (postgres). |
| its library is not loaded | Add pg_stat_statements to shared_preload_libraries (Variables, linked from the note) and restart the server. phpPgAdmin cannot restart it. |
| not available on this server | Install PostgreSQL's contrib modules (the postgresql-contrib package on most systems). |
Counters
Counters (/server/status/counters) is phpMyAdmin's All status variables for PostgreSQL's cumulative statistics, one row per counter with its Variable, Value and Description:
pg_stat_database, summed over every database, or for the database chosen in the database select: connections, transactions committed and rolled back, blocks read and hit, rows returned, fetched, inserted, updated and deleted, recovery conflicts, temporary files and bytes, deadlocks, checksum failures, I/O times, session times and counts (PostgreSQL 14 and later), parallel workers (PostgreSQL 18), and when the counters were reset;pg_stat_bgwriter, the background writer's counters (before PostgreSQL 17 it holds the checkpoint counters too);pg_stat_checkpointer, from PostgreSQL 17, the checkpoints and restartpoints;pg_stat_wal, the WAL records, full page images and bytes generated, and how often the WAL buffers were full.
Under the counters, from PostgreSQL 16, the pg_stat_io card lists the I/O of each backend type, object and context with any activity (reads, writes, extends, hits, evictions, fsyncs and their times). Reset shared counters (pg_stat_reset_shared): then names the sets that can be reset on this server (archiver, bgwriter, wal; recovery_prefetch from 15; io from 16; checkpointer and slru from 17); each asks for confirmation and runs SELECT pg_stat_reset_shared('…'), which takes a superuser or an explicit grant.
The Filters card, as phpMyAdmin's:
| Control | What it does |
|---|---|
| Containing the word: | Keeps the counters whose name contains the text (a space matches _). |
| Show only alert values | Keeps the counters shown in red. |
| Filter by category… | One view: Databases, Background writer, Checkpointer or WAL. |
| database select | pg_stat_database of that database instead of the sum. |
| Show unformatted values | Shows the raw numbers. Formatted, numbers of 1000 and more are shortened (1.5 M), with the exact number on hover. |
| Refresh | Reads the counters again. |
Some counters are coloured as phpMyAdmin colours its alert values: red when the value is a warning sign, green when it is fine. Red means deadlocks, recovery conflicts, checksum failures, abandoned or fatal sessions, a buffer cache hit ratio under 90 % (on blks read), a background writer that hit bgwriter_lru_maxpages (maxwritten clean) or backends doing their own fsync, and more requested than scheduled checkpoints (often a sign that max_wal_size is too small). The help icon of a row opens the view's documentation.
Locks
Locks (/server/status/locks) lists pg_locks, pgAdmin's Locks panel.

- Show only waiting locks keeps the locks not granted yet (
granted = false). - The database select limits the list to locks in one database.
- Columns: PID, Lock type, Database, Relation, Page, Tuple, Virtual XID, Transaction ID, Class, Object ID, Sub-object, Virtual transaction, Mode, Granted and Fast path. A lock that is not granted is highlighted.
The list includes the AccessShareLock on pg_locks taken by the query that reads it. To end a lock wait, cancel or terminate the holding session on the Processes page; its PID is in the waiting session's Blocked by column.
A database's processes and locks
Each database has a Processes tab with Processes and Locks pills: the two pages above, limited to that database, as the classic phpPgAdmin's database Processes and Locks pages were.
Prepared transactions
Prepared transactions (/server/status/prepared) lists pg_prepared_xacts: transactions prepared for two-phase commit with PREPARE TRANSACTION, which survive a restart and keep their locks until someone commits or rolls them back.
Columns: Global ID, Database, Owner, Transaction and Prepared at. The database select limits the list to one database. Each row has:
- Commit, which runs
COMMIT PREPARED 'gid'; - Rollback, which runs
ROLLBACK PREPARED 'gid';
Both ask first. PostgreSQL requires you to be the role that prepared the transaction, or a superuser, and the statement cannot run inside a transaction block (phpPgAdmin runs it on its own).
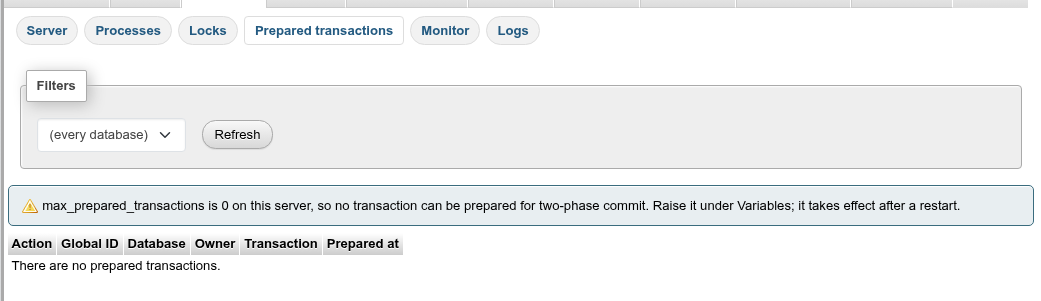
max_prepared_transactions must be above 0
The default max_prepared_transactions is 0, and then PREPARE TRANSACTION fails with prepared transactions are disabled. The page says so above the (empty) list. Raise the setting under Variables; it is a postmaster setting, so it takes effect after a server restart. phpPgAdmin cannot restart the server.
Monitor
Monitor (/server/status/monitor) plots pgAdmin's dashboard charts live, sampled from pg_stat_activity and pg_stat_database at the refresh rate:
| Chart | Series |
|---|---|
| Sessions | Total, Active, Idle |
| Transactions per second | Transactions, Commits, Rollbacks |
| Tuples in per second | Inserts, Updates, Deletes |
| Tuples out per second | Fetched, Returned |
| Block I/O per second | Reads, Hits |
The legend shows the latest value of each series. A chart keeps the last 60 intervals (5 minutes at the default rate of 5 seconds). The per-second charts need two samples before they draw a line.
- Pause monitor stops sampling; Resume monitor starts it again (the plotted points stay).
- Settings opens the Refresh rate (2 seconds to 20 minutes), Chart columns (1 to 5) and Database selects. Choosing a database limits every chart to it and starts the charts over.
The charts sample only while the page is open; nothing is recorded in the background.
Background jobs
Background jobs (/server/status/jobs) is pgAdmin's Processes panel: every background process you started on this server, newest first, whichever page started it: imports of the server, a database, a schema or a table, and maintenance commands (VACUUM, ANALYZE, REINDEX, CLUSTER of a database or schema). The Import page links to it.
Columns: Type (Import or Maintenance), Description (the file imported, or the command), Target (the server, or the database, schema and table, each a link), State (Running, Finished, Failed with the exit code, Stopped, or Lost when the runner went away without reporting), Started, Finished, Duration (counting while it runs) and Errors (error lines the program printed). The type select limits the list to one type. While a job runs the list reloads every two seconds.
Each row has:
- View output: the job's card in a dialog, as the Import page shows it: its state, progress, command and output, followed live while it runs, with Stop or Dismiss;
- Stop, while it runs: the same as the card's Stop (
SIGINT, thenSIGTERM); - Dismiss, once it ended: removes it from every list and deletes its output.
Jobs are your role's on this server: another role, or the same role on another server, does not see them.
System statistics
pgAdmin's System Statistics dashboard, from EDB's system_stats extension. The System statistics pill (/server/status/system) appears only when system_stats is installed in the database you signed in to (the maintenance database, usually postgres); elsewhere it is not shown.
Its tabs are pgAdmin's:
| Tab | Shows |
|---|---|
| Summary | pg_sys_os_info() (OS, host, architecture, uptime, process, thread and handle counts), pg_sys_cpu_info(), pg_sys_process_info(), and a Process & handle count graph |
| CPU | CPU usage (user, kernel, I/O wait %) and Load average (1, 5, 15 minutes) graphs, pg_sys_cpu_usage_info(), pg_sys_load_avg_info(), and the processes by CPU from pg_sys_cpu_memory_by_process() |
| Memory | Memory and Swap memory graphs, pg_sys_memory_info(), and the processes by memory |
| Storage | pg_sys_disk_info() (mounted drives) and pg_sys_io_analysis_info() |
The graphs are drawn from the samples taken each time the tab loads: start auto refresh with the rate you want, as on the Processes page. A function the server's platform does not provide shows Not available on this server with the server's message instead of its rows; the graphs use the Linux column names and are left out where those columns are missing.
Not tried against a live system_stats
The local test server has no system_stats. The page was checked with stand-in functions of system_stats 3's names and Linux columns.
See also
- Server logs, the Logs pill.
- Variables for
max_connections,max_prepared_transactionsand the statistics settings (track_activities,track_counts). - Databases: the same
pg_stat_databasecounters per database. - Objects to create the
pg_stat_statementsextension.